This is archived documentation for InfluxData product versions that are no longer maintained. For newer documentation, see the latest InfluxData documentation.
Easily modify the time range and tag values displayed by a visualization and/or dashboard.
Templating a visualization
The following sections will show you how to create template variables on a graph. If you’d like to follow along, see Getting Started with Telegraf to get the data we use in this section.
Template time range with tmplTime()
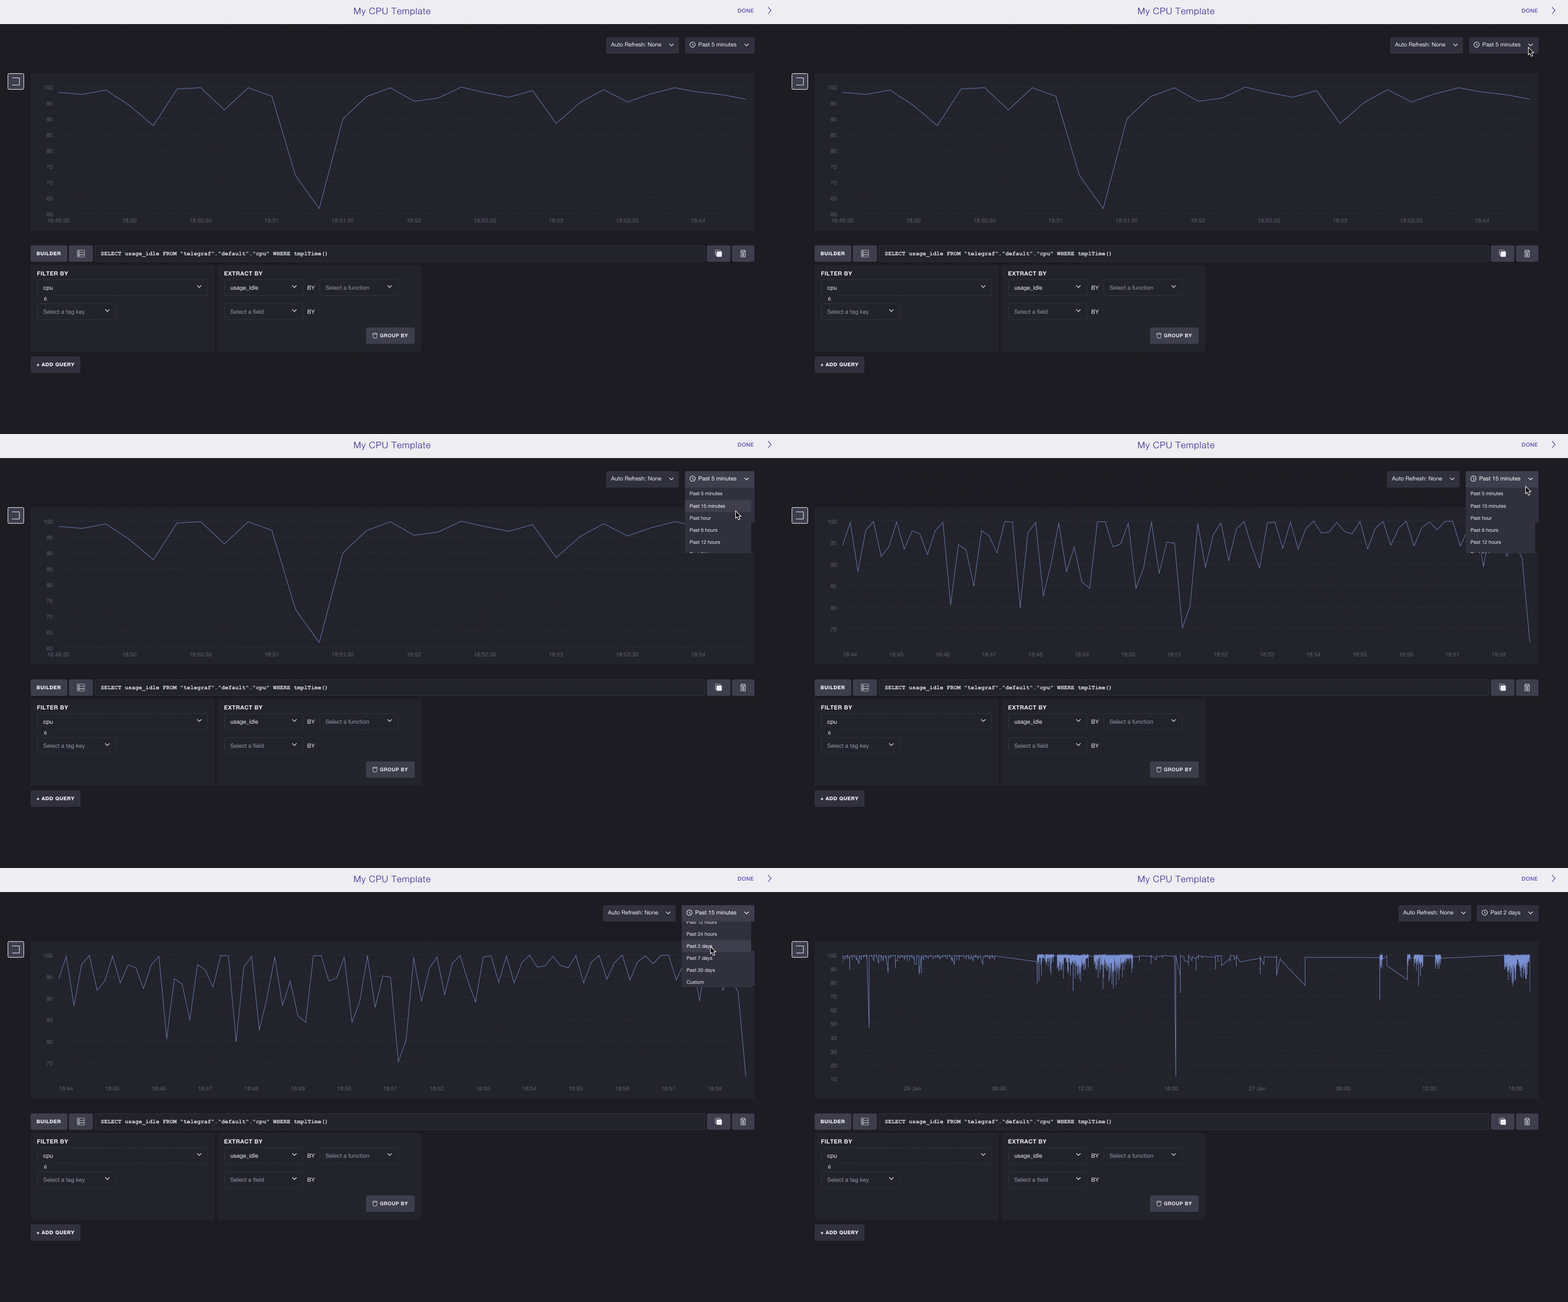
Use the tmplTime() function to create a template variable that controls the query’s time range.
This works for queries that use the query builder as well as manually entered queries.
Example:
Once you enter the query below, you can select alternative time ranges by clicking on the dropdown in the top right corner.
Query:
SELECT usage_idle FROM "telegraf"."default"."cpu" WHERE tmplTime()
Chronograf visualization with a time template variable:

Template tag values with tmplTagValue()
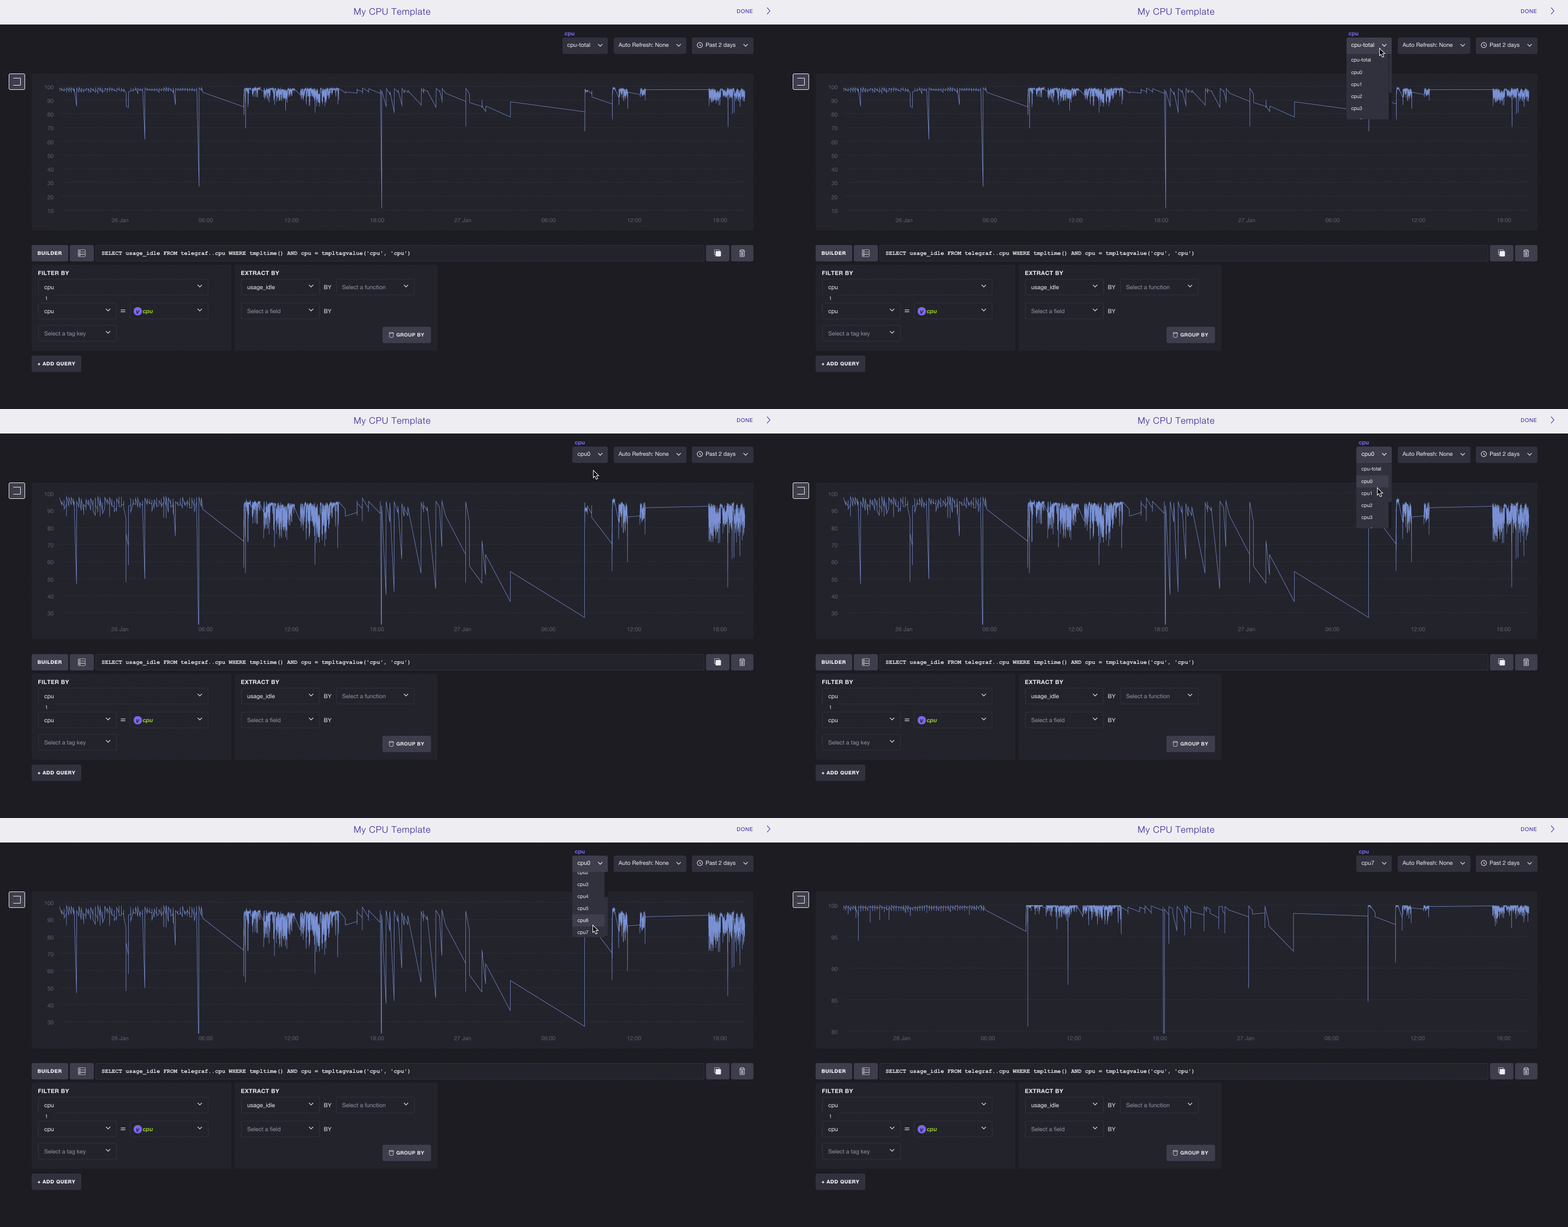
Use the tmplTagValue() function to create a template variable that allows you to change the value of the query’s tag key(s).
Example:
In the FILTER BY section of the Query Builder:
1.
Select the tag key that you want to template (here, we choose cpu).
2.
Select Make Variable as the Tag Value.
3.
Save the title of your template variable in the Make Tag Value Variable window (here, we name it cpu).
Now you can select alternative tag values of the tag key cpu in the cpu dropdown in the top right corner.
Note: If you’d like to enter the
tmplTagValue()function manually, place in theWHEREclause:<tag_key> = tmplTagValue('<tag_key>','<variable_name>')Where
variable_nameis the title of the dropdown that appears in the top right corner.
Chronograf visualization with a tag template variable:

Templating a dashboard
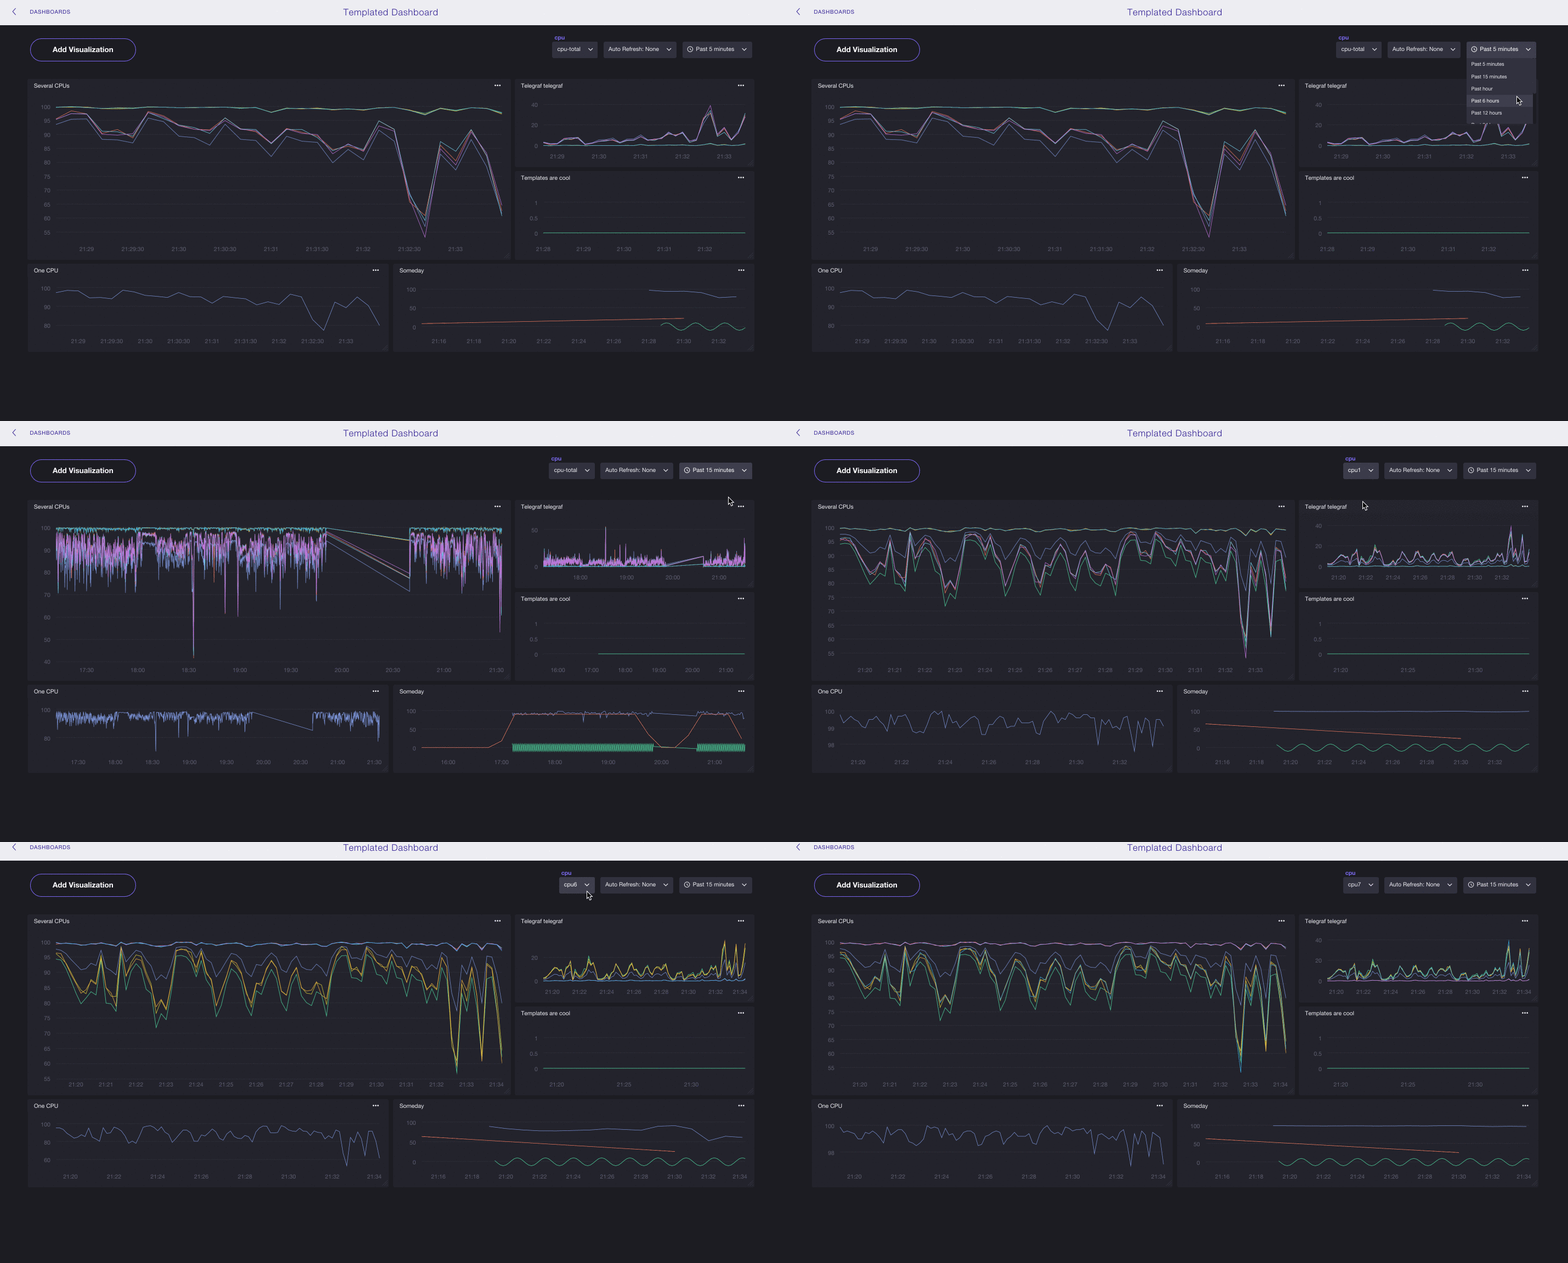
Chronograf’s template variables also work on dashboards. Note that only visualizations that specify tmplTime() and/or tmplTagValue() will work with the template variables.
Chronograf dashboard with template variables:
