This is archived documentation for InfluxData product versions that are no longer maintained. For newer documentation, see the latest InfluxData documentation.
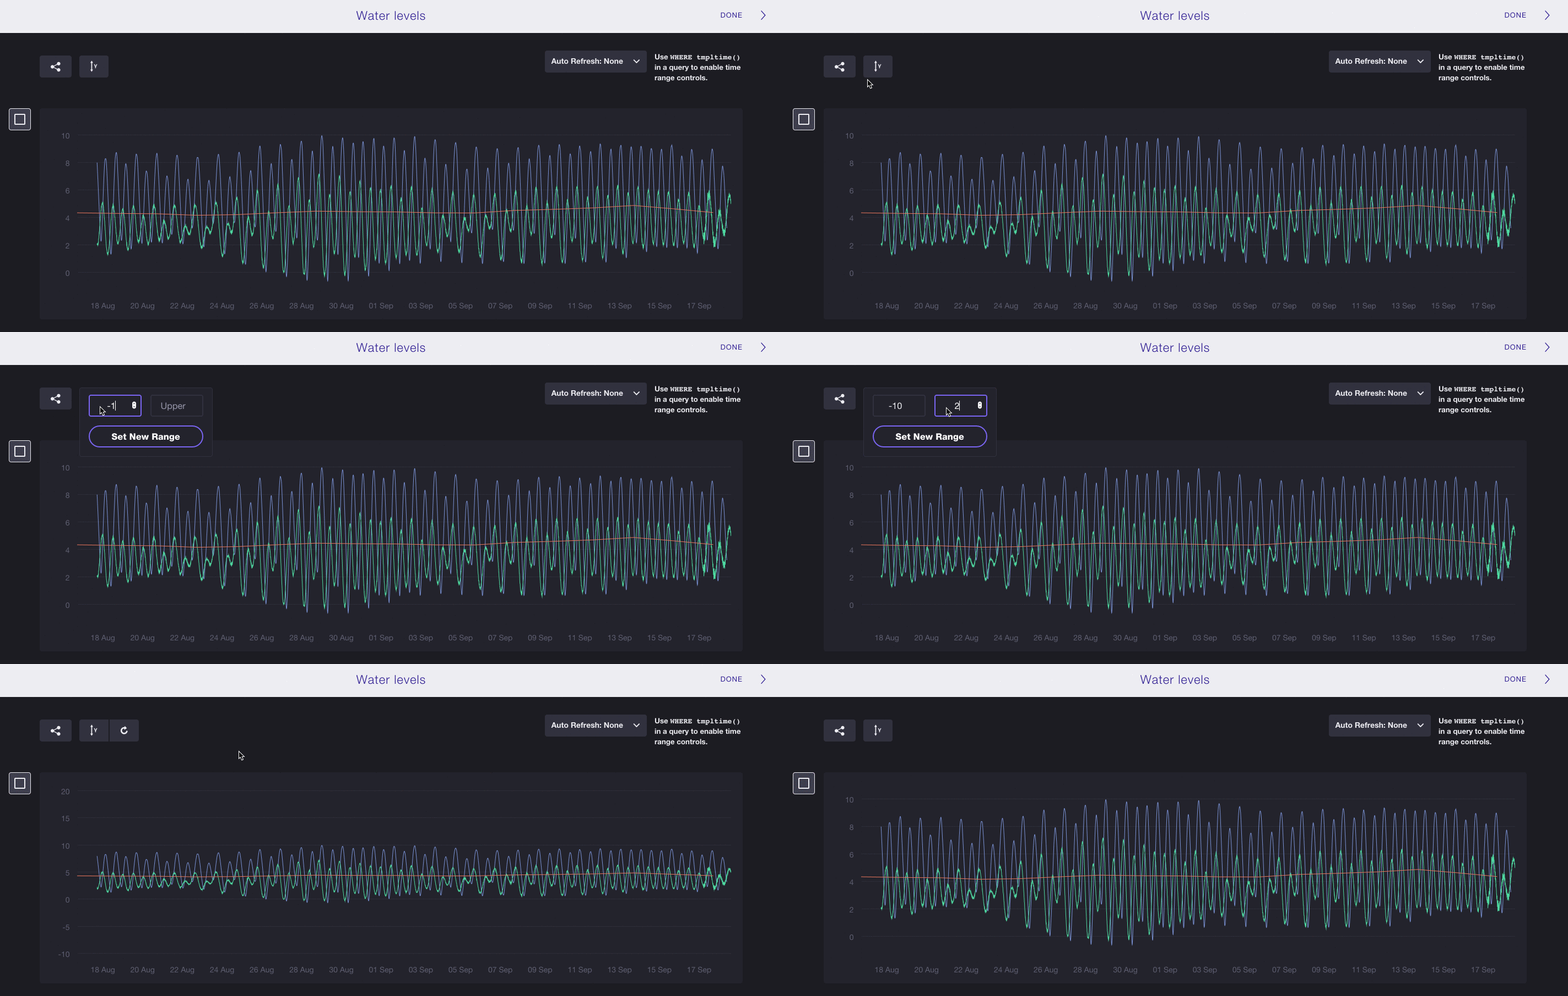
Can I customize the y-axis range?
Yes. As of version 0.11, users can customize the y-axis range in Chronograf:
