This is archived documentation for InfluxData product versions that are no longer maintained. For newer documentation, see the latest InfluxData documentation.
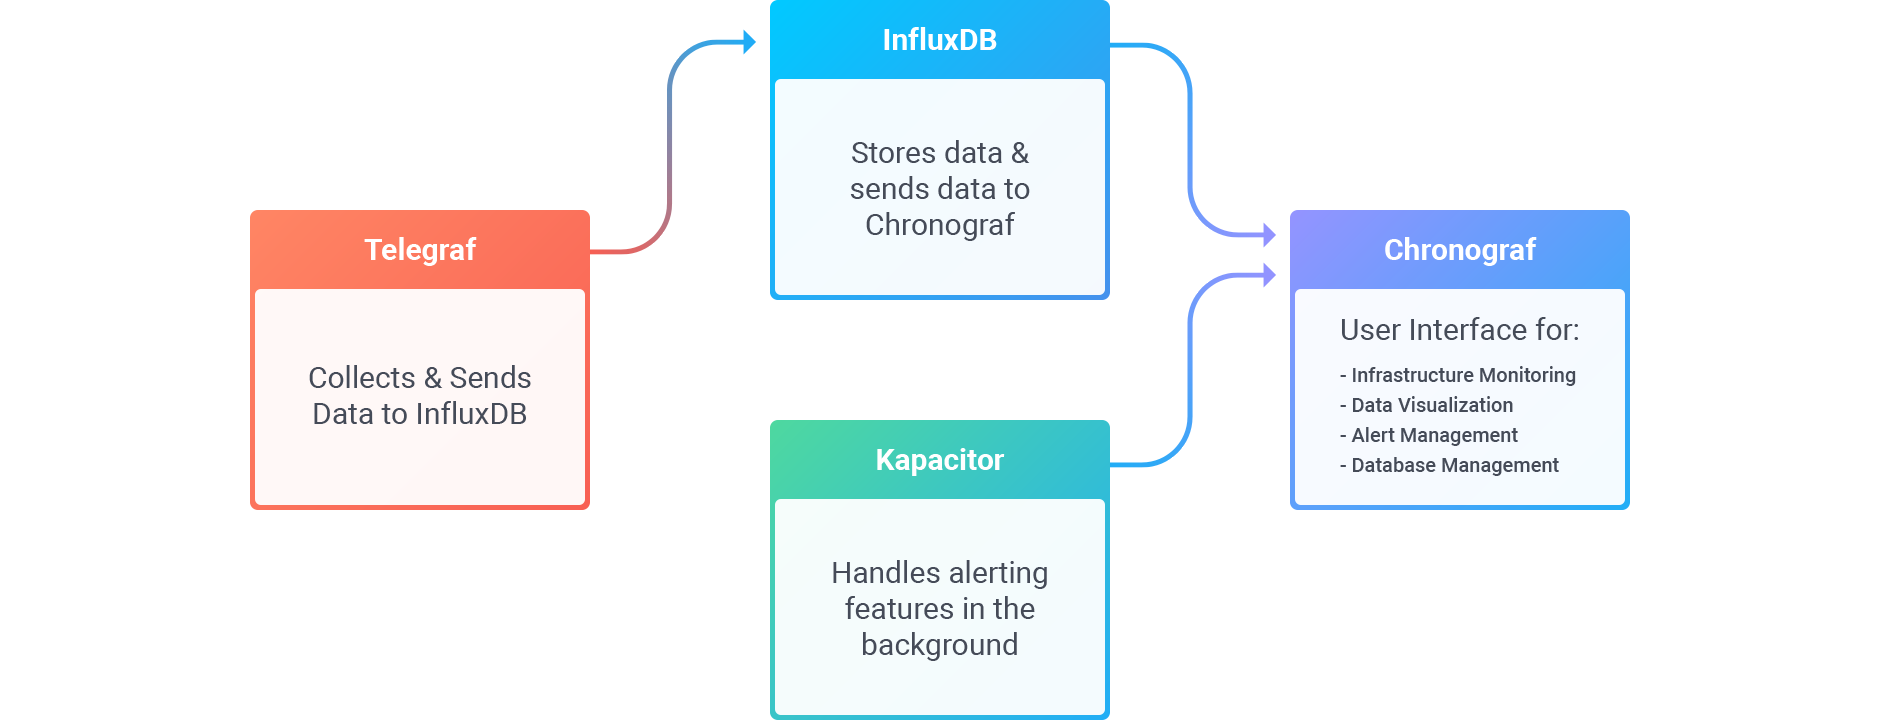
Chronograf is the user interface component of InfluxData’s TICK stack. It makes owning the monitoring and alerting for your infrastructure easy to setup and maintain.
The next sections will get you up and running with Chronograf with as little configuration and code as possible. By the end of this document, you will have downloaded, installed, and configured all four packages of the TICK stack (Telegraf, InfluxDB, Chronograf, and Kapacitor), and you will be all set to monitor your infrastructure.
Requirements
This guide walks through getting set up on an Ubuntu 16.04 installation, and is applicable to most flavors of Linux. Chronograf and the other components of the TICK stack are supported on a large number of operating systems and hardware architectures. Check out the downloads page for links to the binaries of your choice.
For a complete list of the installation requirements, see the Installation page.
InfluxDB Setup
InfluxDB is the time series database that serves as the data storage component of the TICK stack.
1. Download and Install InfluxDB
wget https://dl.influxdata.com/influxdb/releases/influxdb_1.2.4_amd64.deb
sudo dpkg -i influxdb_1.2.4_amd64.deb
2. Start InfluxDB
There’s no need to edit InfluxDB’s default configuration for the purposes of this guide. Just start InfluxDB with:
sudo systemctl start influxdb
3. Verify that InfluxDB is Running
Run the SHOW DATABASES command using curl:
curl "http://localhost:8086/query?q=show+databases"
If InfluxDB is up and running, you should see an object that contains the _internal database:
{"results":[{"statement_id":0,"series":[{"name":"databases","columns":["name"],"values":[["_internal"]]}]}]}So far so good! You’re ready to move on to the next section. Note that there’s no need to create your own database on your InfluxDB instance; the other components of the TICK stack will handle that for you.
Kapacitor Setup
Kapacitor is the data processing platform of the TICK stack. Kapacitor is responsible for creating and sending alerts in Chronograf.
1. Download and Install Kapacitor
wget https://dl.influxdata.com/kapacitor/releases/kapacitor_1.3.1_amd64.deb
sudo dpkg -i kapacitor_1.3.1_amd64.deb
2. Start Kapacitor
sudo systemctl start kapacitor
3. Verify that Kapacitor is Running
Check the task list of Kapacitor with:
kapacitor list tasks
If Kapacitor is up and running, you should see an empty list of tasks:
ID Type Status Executing Databases and Retention Policies
If there was a problem you will see an error message:
Get http://localhost:9092/kapacitor/v1/tasks?dot-view=attributes&fields=type&fields=status&fields=executing&fields=dbrps&limit=100&offset=0&pattern=&replay-id=&script-format=formatted: dial tcp [::1]:9092: getsockopt: connection refused
Telegraf Setup
Telegraf is the metrics gathering agent in the TICK stack. For the purposes of this guide, we set up Telegraf to collect system stats data on your machine and write those metrics to your existing InfluxDB instance.
In a production environment, Telegraf would be installed on your servers and would point the output to an InfluxDB instance on a separate machine. Ultimately, you will configure a Telegraf input plugin for each application that you want to monitor.
1. Download and Install Telegraf
wget https://dl.influxdata.com/telegraf/releases/telegraf_1.3.2-1_amd64.deb
sudo dpkg -i telegraf_1.3.2-1_amd64.deb
2. Start Telegraf
sudo systemctl start telegraf
3. Verify Telegraf’s Configuration and that the Process is Running
Step 2 should create a configuration file with system stats as an input plugin and InfluxDB as an output plugin.
Double check the configuration file at /etc/telegraf/telegraf.conf for the relevant input and output settings.
The OUTPUT PLUGINS section should have the following settings for the InfluxDB output:
[[outputs.influxdb]]
  ## The full HTTP or UDP endpoint URL for your InfluxDB instance.
  ## Multiple urls can be specified as part of the same cluster,
  ## this means that only ONE of the urls will be written to each interval.
  # urls = ["udp://localhost:8089"] # UDP endpoint example
  urls = ["http://localhost:8086"] # required
  ## The target database for metrics (telegraf will create it if not exists).
  database = "telegraf" # required

  ## Retention policy to write to. Empty string writes to the default rp.
  retention_policy = ""
  ## Write consistency (clusters only), can be: "any", "one", "quorum", "all"
  write_consistency = "any"

  ## Write timeout (for the InfluxDB client), formatted as a string.
  ## If not provided, will default to 5s. 0s means no timeout (not recommended).
  timeout = "5s"
  # username = "telegraf"
  # password = "metricsmetricsmetricsmetrics"
  ## Set the user agent for HTTP POSTs (can be useful for log differentiation)
  # user_agent = "telegraf"
  ## Set UDP payload size, defaults to InfluxDB UDP Client default (512 bytes)
  # udp_payload = 512
Next, the INPUT PLUGINS section should have the following settings for the system stats input:
# Read metrics about cpu usage
[[inputs.cpu]]
  ## Whether to report per-cpu stats or not
  percpu = true
  ## Whether to report total system cpu stats or not
  totalcpu = true
  ## If true, collect raw CPU time metrics.
  collect_cpu_time = false


# Read metrics about disk usage by mount point
[[inputs.disk]]
  ## By default, telegraf gather stats for all mountpoints.
  ## Setting mountpoints will restrict the stats to the specified mountpoints.
  # mount_points = ["/"]

  ## Ignore some mountpoints by filesystem type. For example (dev)tmpfs (usually
  ## present on /run, /var/run, /dev/shm or /dev).
  ignore_fs = ["tmpfs", "devtmpfs"]


# Read metrics about disk IO by device
[[inputs.diskio]]
  ## By default, telegraf will gather stats for all devices including
  ## disk partitions.
  ## Setting devices will restrict the stats to the specified devices.
  # devices = ["sda", "sdb"]
  ## Uncomment the following line if you need disk serial numbers.
  # skip_serial_number = false


# Get kernel statistics from /proc/stat
[[inputs.kernel]]
  # no configuration


# Read metrics about memory usage
[[inputs.mem]]
  # no configuration


# Get the number of processes and group them by status
[[inputs.processes]]
  # no configuration


# Read metrics about swap memory usage
[[inputs.swap]]
  # no configuration


# Read metrics about system load & uptime
[[inputs.system]]
  # no configuration
If this looks like your configuration then we can run a quick test to ensure that the system stats are being written to InfluxDB:
curl "http://localhost:8086/query?q=select+*+from+telegraf..cpu"
If Telegraf is setup properly you should see a lot of JSON data; if the output is empty than something has gone wrong.
Chronograf Setup
Now that we’re collecting data with Telegraf and storing data with InfluxDB, it’s time to install Chronograf to begin viewing and monitoring the data.
1. Download and Install Chronograf
wget https://dl.influxdata.com/chronograf/releases/chronograf_1.3.3.0_amd64.deb
sudo dpkg -i chronograf_1.3.3.0_amd64.deb
2. Start Chronograf
sudo systemctl start chronograf
3. Connect to Chronograf
Assuming everything is up and running we should be able to connect to and configure Chronograf.
Point your web browser to http://localhost:8888 (replace localhost with your server’s IP if you’re not running on localhost).
You should see a welcome page:
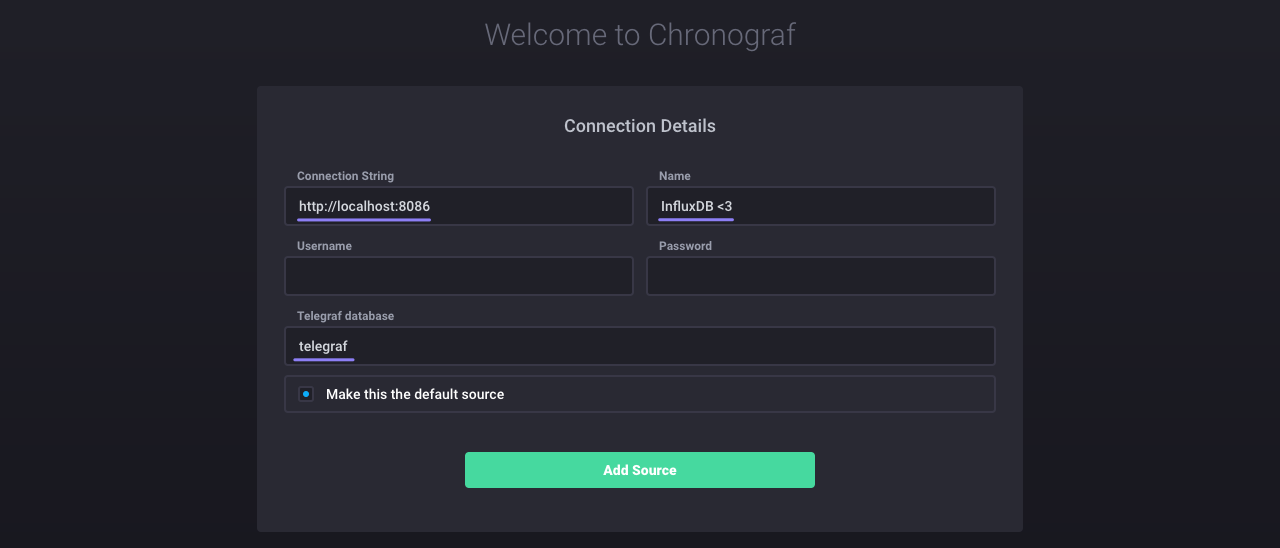
The next steps connect Chronograf to your InfluxDB instance.
For the Connection String, enter the hostname or IP of the machine that InfluxDB is running on, and be sure to include InfluxDB’s default port: 8086.
Next, name the connection string; this can be anything you want.
There’s no need to edit the last three inputs; authorization is disabled in InfluxDB’s default configuration so Username and Password can remain blank, and Telegraf’s default database name is telegraf.
Click Connect New Source to move on to the HOST LIST page:

You should see your machine’s hostname on the page along with information about its CPU usage and load.
Assuming you’ve configured Telegraf’s system stats input plugin, system should appear in the Apps column.
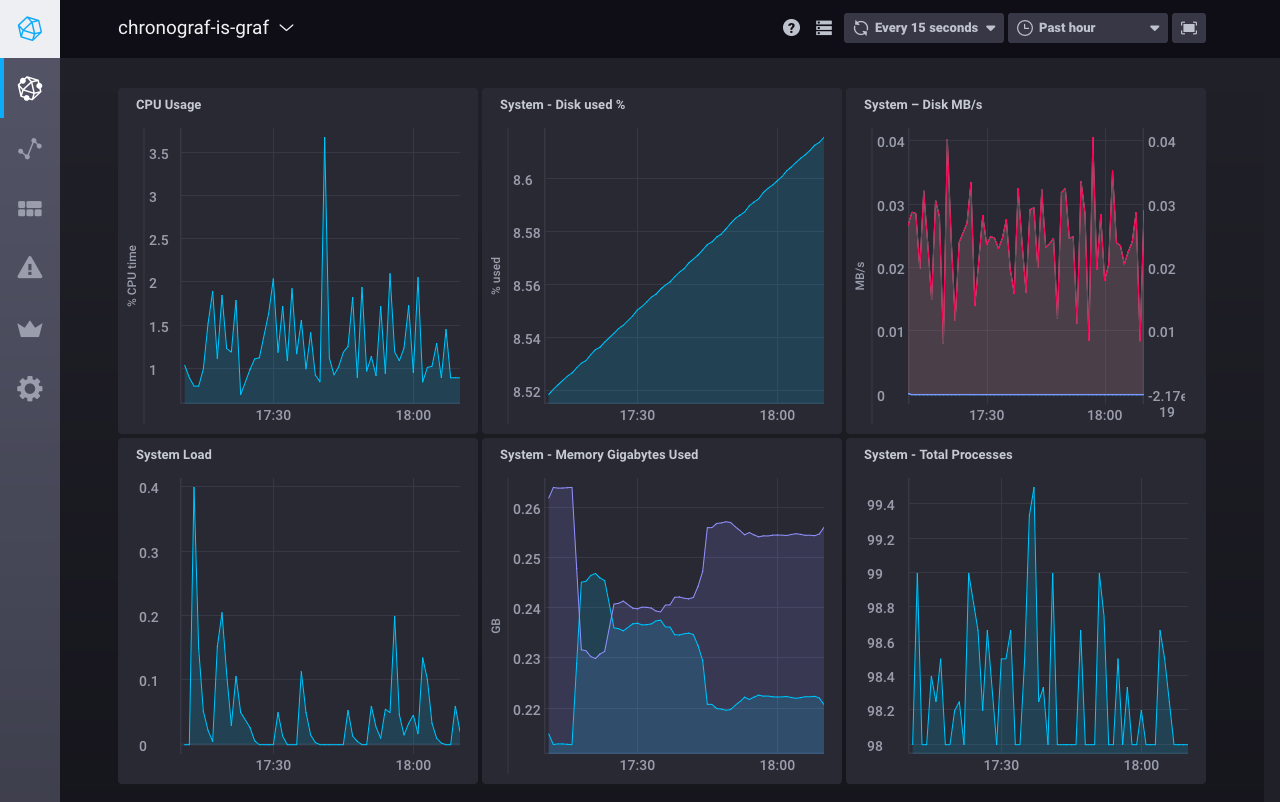
Go ahead and click on the hostname to see a series of system level graphs about
your host:
4. Connect Chronograf to Kapacitor
The final step in the installation process is to connect Chronograf to Kapacitor.
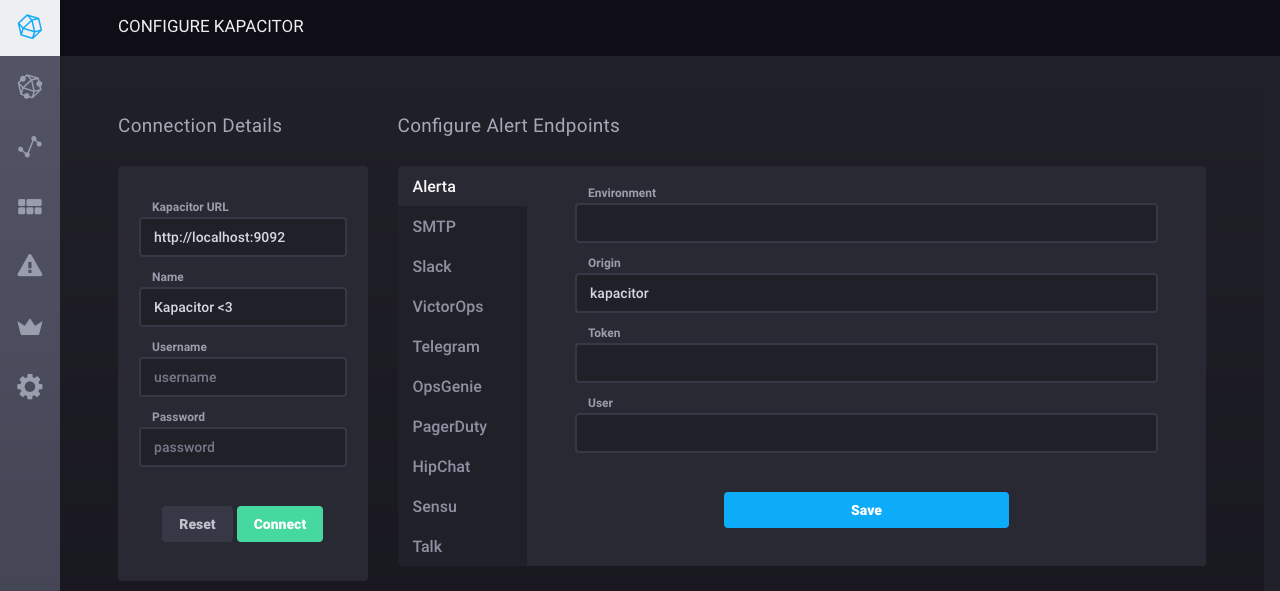
Navigate to the Configuration page (the last item in the sidebar) and click Add Config in the Active Kapacitor column.
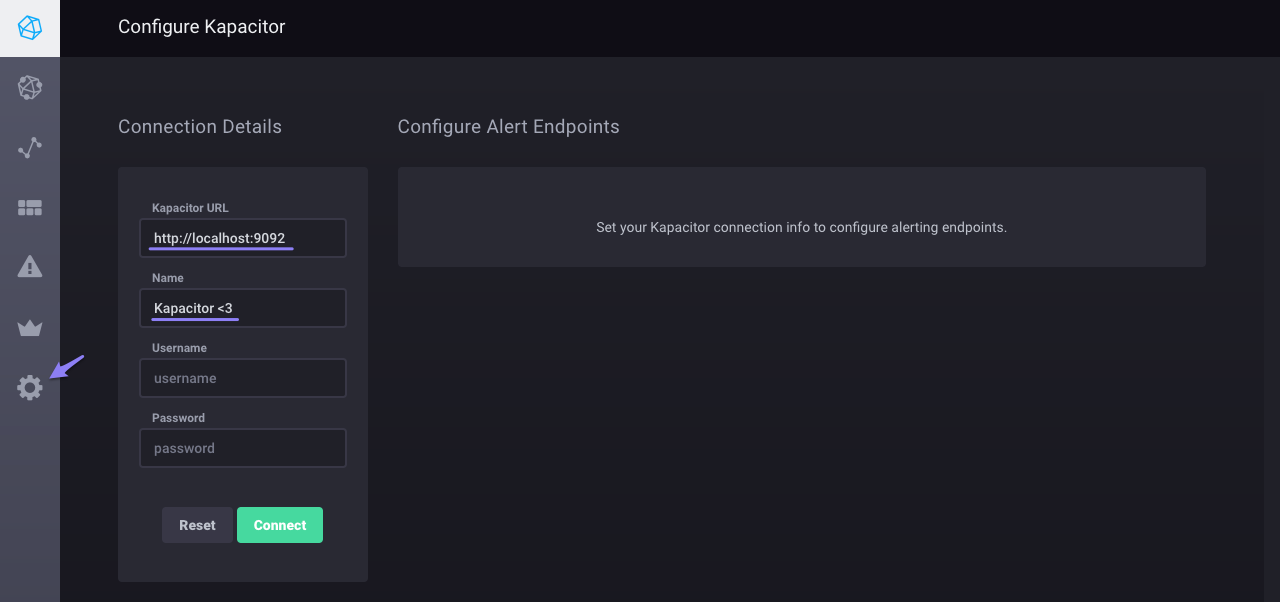
For the Kapacitor URL, enter the hostname or IP of the machine that Kapacitor is running on, and be sure to include Kapacitor’s default port: 9092.
Next, name the connection string; this can be anything you want.
There’s no need to enter any information for the Username and Password inputs as authorization is disabled in Kapacitor’s default configuration.
Finally, click Connect.
When Kapacitor successfully connects, Chronograf automatically opens the Configure Alert Endpoints section.
Kapacitor supports several alert endpoints/event handlers.
See the Configure Kapacitor Event Handlers guide for more information.
That’s it! You’ve successfully downloaded, installed, and configured each component of the TICK stack. Next, check out our guides to get familiar with Chronograf and see all that it can do for you!