This is archived documentation for InfluxData product versions that are no longer maintained. For newer documentation, see the latest InfluxData documentation.
Using annotations in the Chronograf interface
Annotations in Chronograf are notes of explanation or comments added to graph views by editors or administrators. Annotations can provide Chronograf users with useful contextual information about single points in time or time intervals. Users can use annotations to correlate the effects of important events, such as system changes or outages across multiple metrics, with Chronograf data.
When an annotation is added, a solid white line appears on all graph views for that point in time or an interval of time.
Annotations example
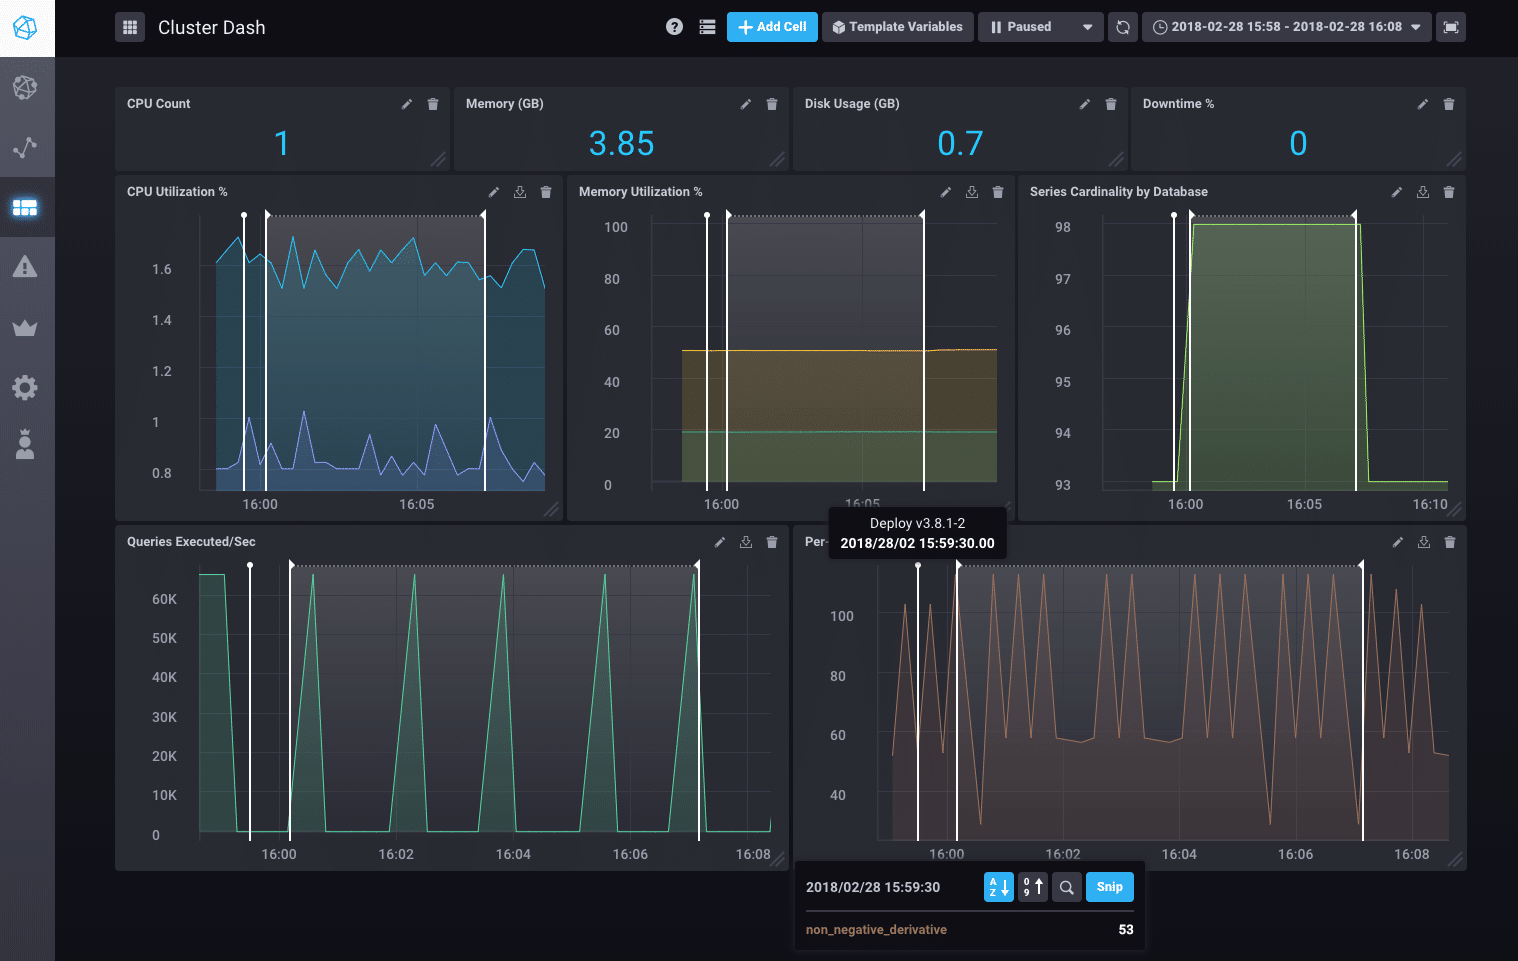
The following screenshot of five graph views displays annotations for a single point in time and a time interval.
The text and timestamp for the single point in time can be seem above the annotation line in the graph view on the lower right.
The annotation displays “Deploy v3.8.1-2” and the time “2018/28/02 15:59:30:00”.
To add an annotation using the Chronograf user interface:
- Click the Edit button (“pencil” icon) on the graph view.
- Click Add Annotation to add an annotation.
- Move cursor to point of time and click or drag cursor to set an annotation.
- Click Edit again and then click Edit Annotation.
- Click the cursor on the annotation point or interval. The annotation text box appears above the annotation point or interval.
- Click on
Name Mein the annotation and type a note or comment. - Click Done Editing.
- Your annotation is now available in all graph views.