This is archived documentation for InfluxData product versions that are no longer maintained. For newer documentation, see the latest InfluxData documentation.
Chronograf provides a user interface for Kapacitor, InfluxData’s processing framework for creating alerts, running ETL jobs, and detecting anomalies in your data. Chronograf alert rules correspond to Kapacitor tasks that are designed specifically to trigger alerts whenever data stream values rise above or fall below designated thresholds. Most of the common alerting use cases can be managed using Chronograf, including:
- Thresholds with static ceilings, floors, and ranges.
- Relative thresholds based on unit or percentage changes.
- Deadman switches.
Complex alerts and other tasks must be defined directly in Kapacitor.
By the end of this guide, you’ll have a Chronograf alert rule that sends an alert message to an existing Slack channel whenever your idle CPU usage crosses the 80% threshold.
Requirements
You’ve already downloaded and installed each component of the TICK stack (Telegraf, InfluxDB, Chronograf, and Kapacitor). To follow along, the Telegraf instance must be configured to collect data with the InfluxDB system statistics input plugin and write data to your InfluxDB instance.
You’ve already configured your Kapacitor instance in Chronograf. The Getting Started guide offers step-by-step instructions for each of those requirements.
You have a working Slack instance and have configured it as an event handler in Chronograf. See the Configure Kapacitor Event Handlers guide for detailed configuration instructions.
Configure a Chronograf alert rule
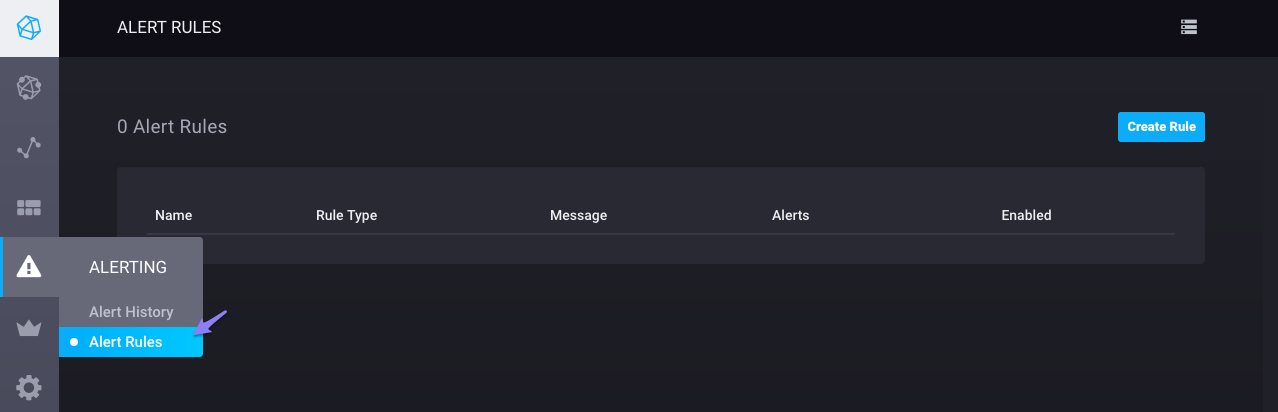
Before you start, navigate to the Rule Configuration page by visiting the Alert Rules page and clicking on the Create Rule button in the top right corner.
The Rule Configuration page is where you create and edit your Chronogra alert rules. Steps one through six walk you through each section of the Rule Configuration page:
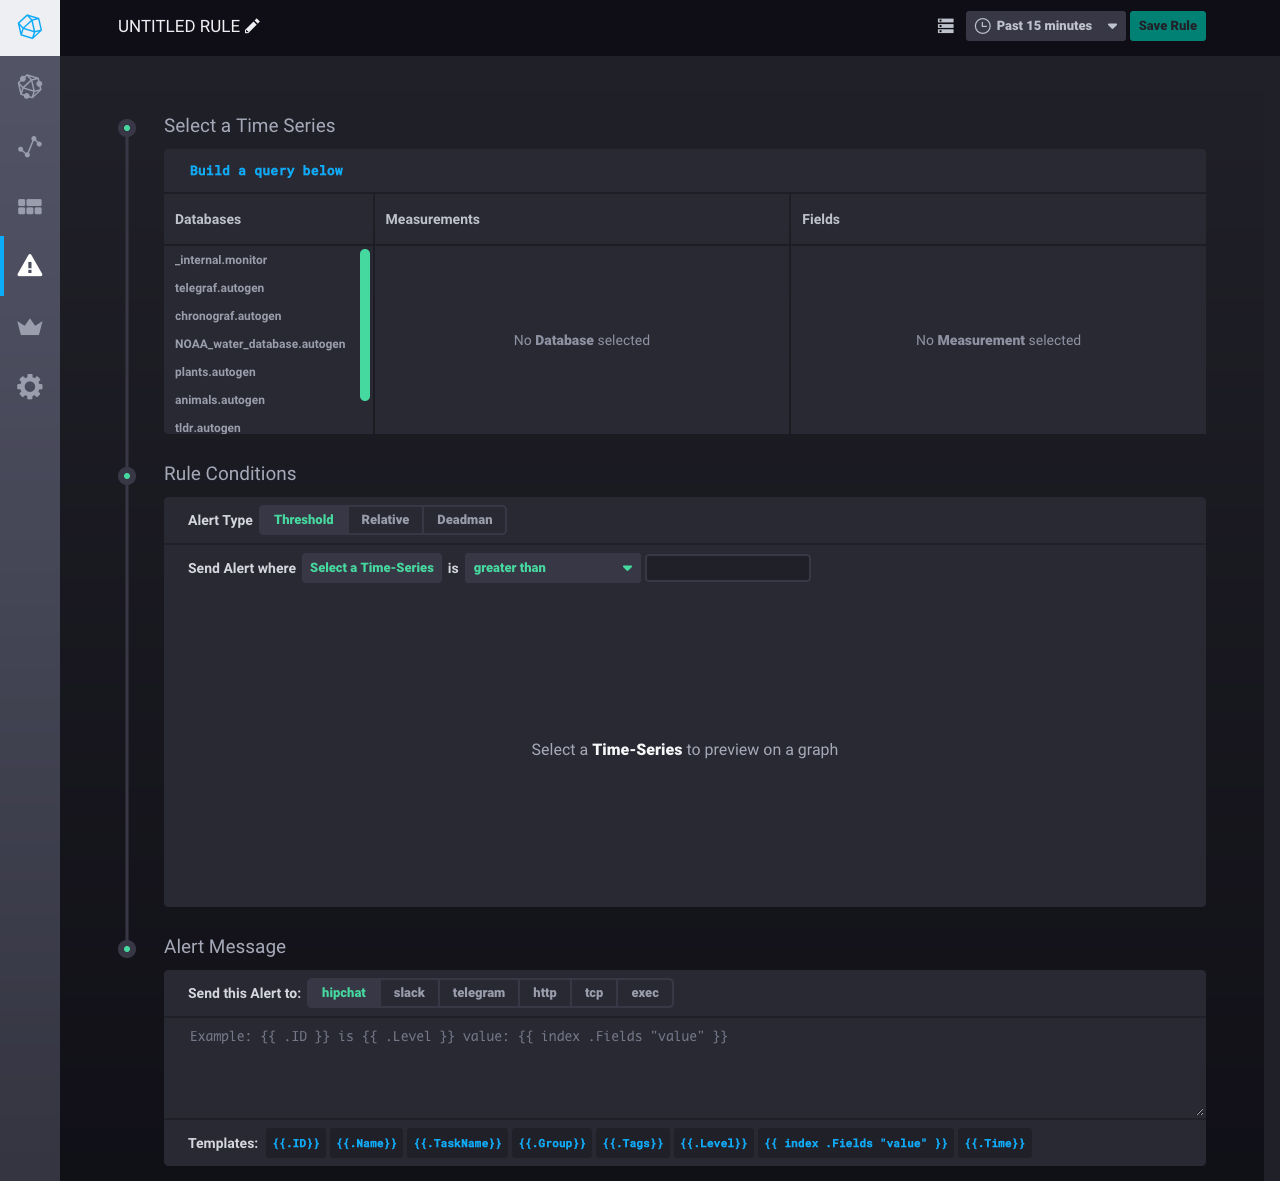
Step 1: Name the rule
Click Untitled Rule in the top left corner and name the rule.
For this example, the rule is named Idle CPU Usage:

Step 2: Select the time series
Choose the data that you want the alert rule to work with.
Navigate through the Databases, Measurements, Fields, and Tags tabs to select the relevant data.
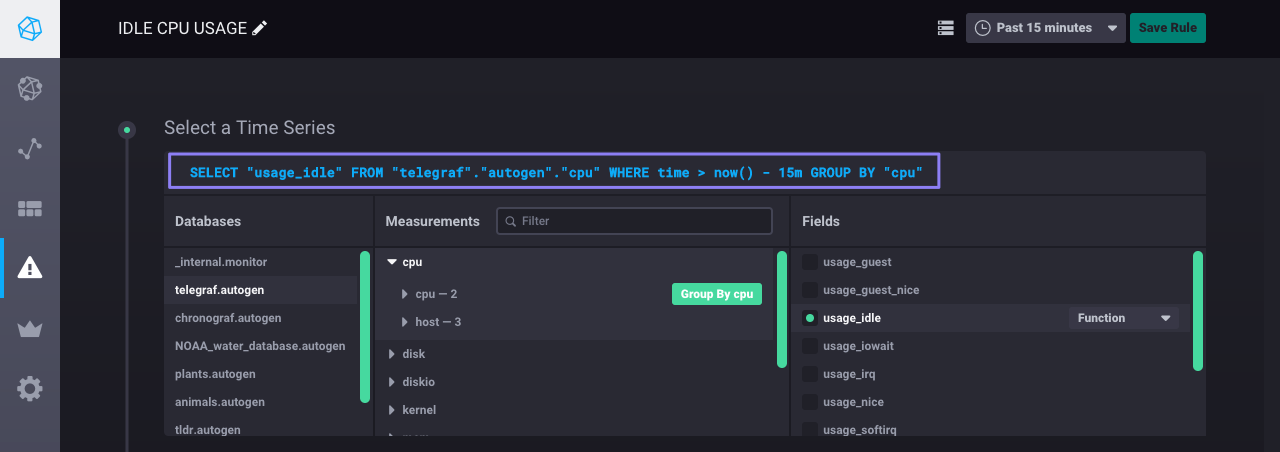
In this example, we select the telegraf database and the autogen retention policy, the cpu measurement, the usage_idle field, and no tags.
The result is the InfluxQL query in the image below.
Notice that Chronograf automatically sets a time range in the WHERE clause.
Don’t modify that for now; the time range is discussed in step four.
Step 3: Select the alert type
Choose from three alert types in the Rule Conditions section of the Rule Configuration page.
The three alert types are:
- Threshold: Alert if the data cross a boundary
- Relative: Alert if the data change relative to the data in a different time range
- Deadman: Alert if InfluxDB receives no relevant data for the specified time duration
For this example, select the Threshold alert type.
Step 4: Define the rule condition
Define the threshold condition:
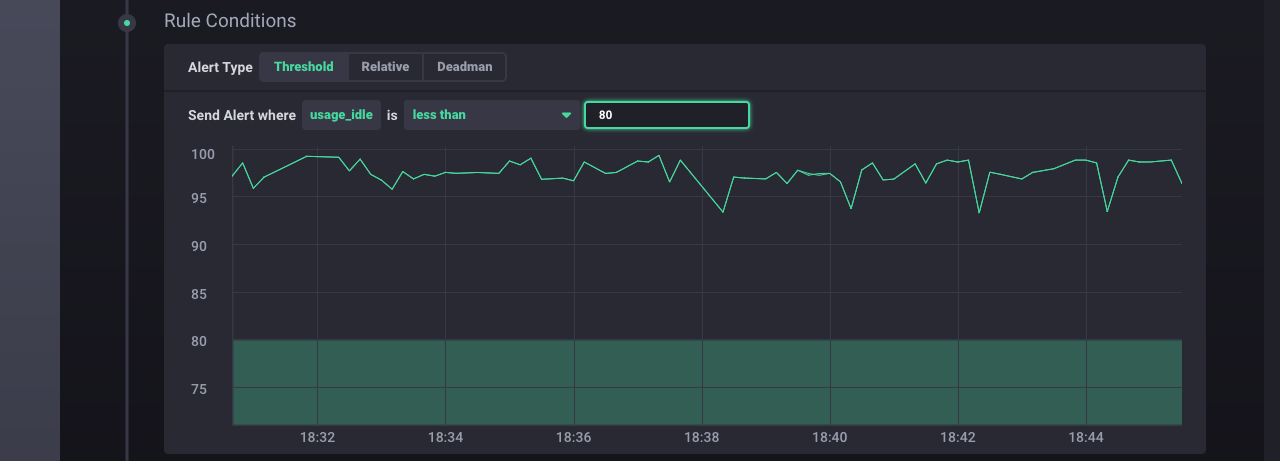
Moving across the inputs from right to left:
usage_idle: The field key specified in theSelect a Time Seriessection.Less than: The condition type. Chronograf supports several condition types.80: The threshold number. The system sends an alert when theusage_idledata cross that boundary.
The graph shows a preview of the relevant data and the threshold number. By default, the graph shows data from the past 15 minutes. The time range selector in the top right corner adjusts the graph’s time range. Use this feature when determining a reasonable threshold number based on your data.
Note: We set the threshold number to
80for demonstration purposes. On our machine, setting the threshold for idle CPU usage to a high number ensures that we’ll be able to see the alert in action. In practice, you’d set the threshold number to better match the patterns in your data and your alert needs.
Step 5: Select the event handler and configure the alert message
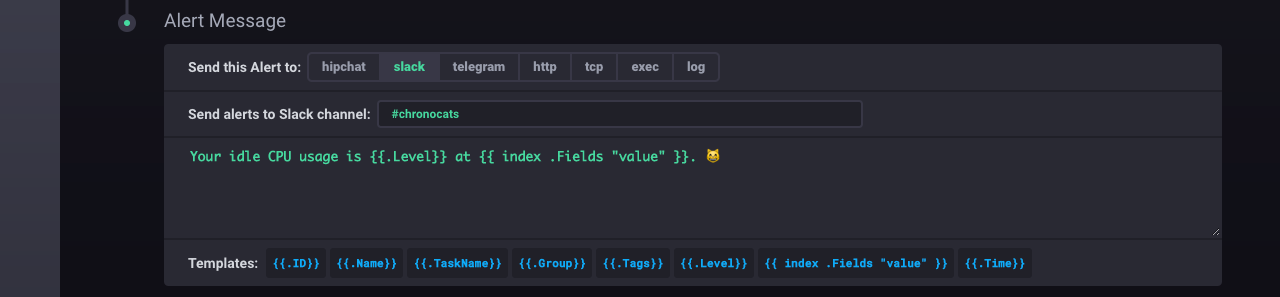
The Alert Message section on the Rule Configuration page determines where the system sends the alert (the event handler) and the text that accompanies the alert (the alert message).
Chronograf supports several event handlers.
Here, we choose to send alerts to Slack, specifically to the existing #chronocats channel.
The alert message is the text that accompanies an alert.
In this example, the alert message is Your idle CPU usage is {{.Level}} at {{ index .Fields "value" }}. 😸.
{{.Level}} is a template that evaluates to CRITICAL when the usage_idle data initially dip below 80% and OK when the usage_idle data first return to 80% or above.
The {{ index .Fields "value" }} template prints the relevant field value that triggered the alert.
Note: There’s no need to include a Slack channel in the
Alert Messagesection if you specified a default channel in the initial Slack configuration. If you did not include a default channel in the initial configuration or if you’d like to send alerts to a non-default channel, specify an alternative Slack channel in this section.
Step 6: Save the alert rule
Click Save Rule in the top right corner and navigate to the A Rule page to see your rule.
Notice that you can easily enable and disable the rule by toggling the checkbox in the Enabled column.
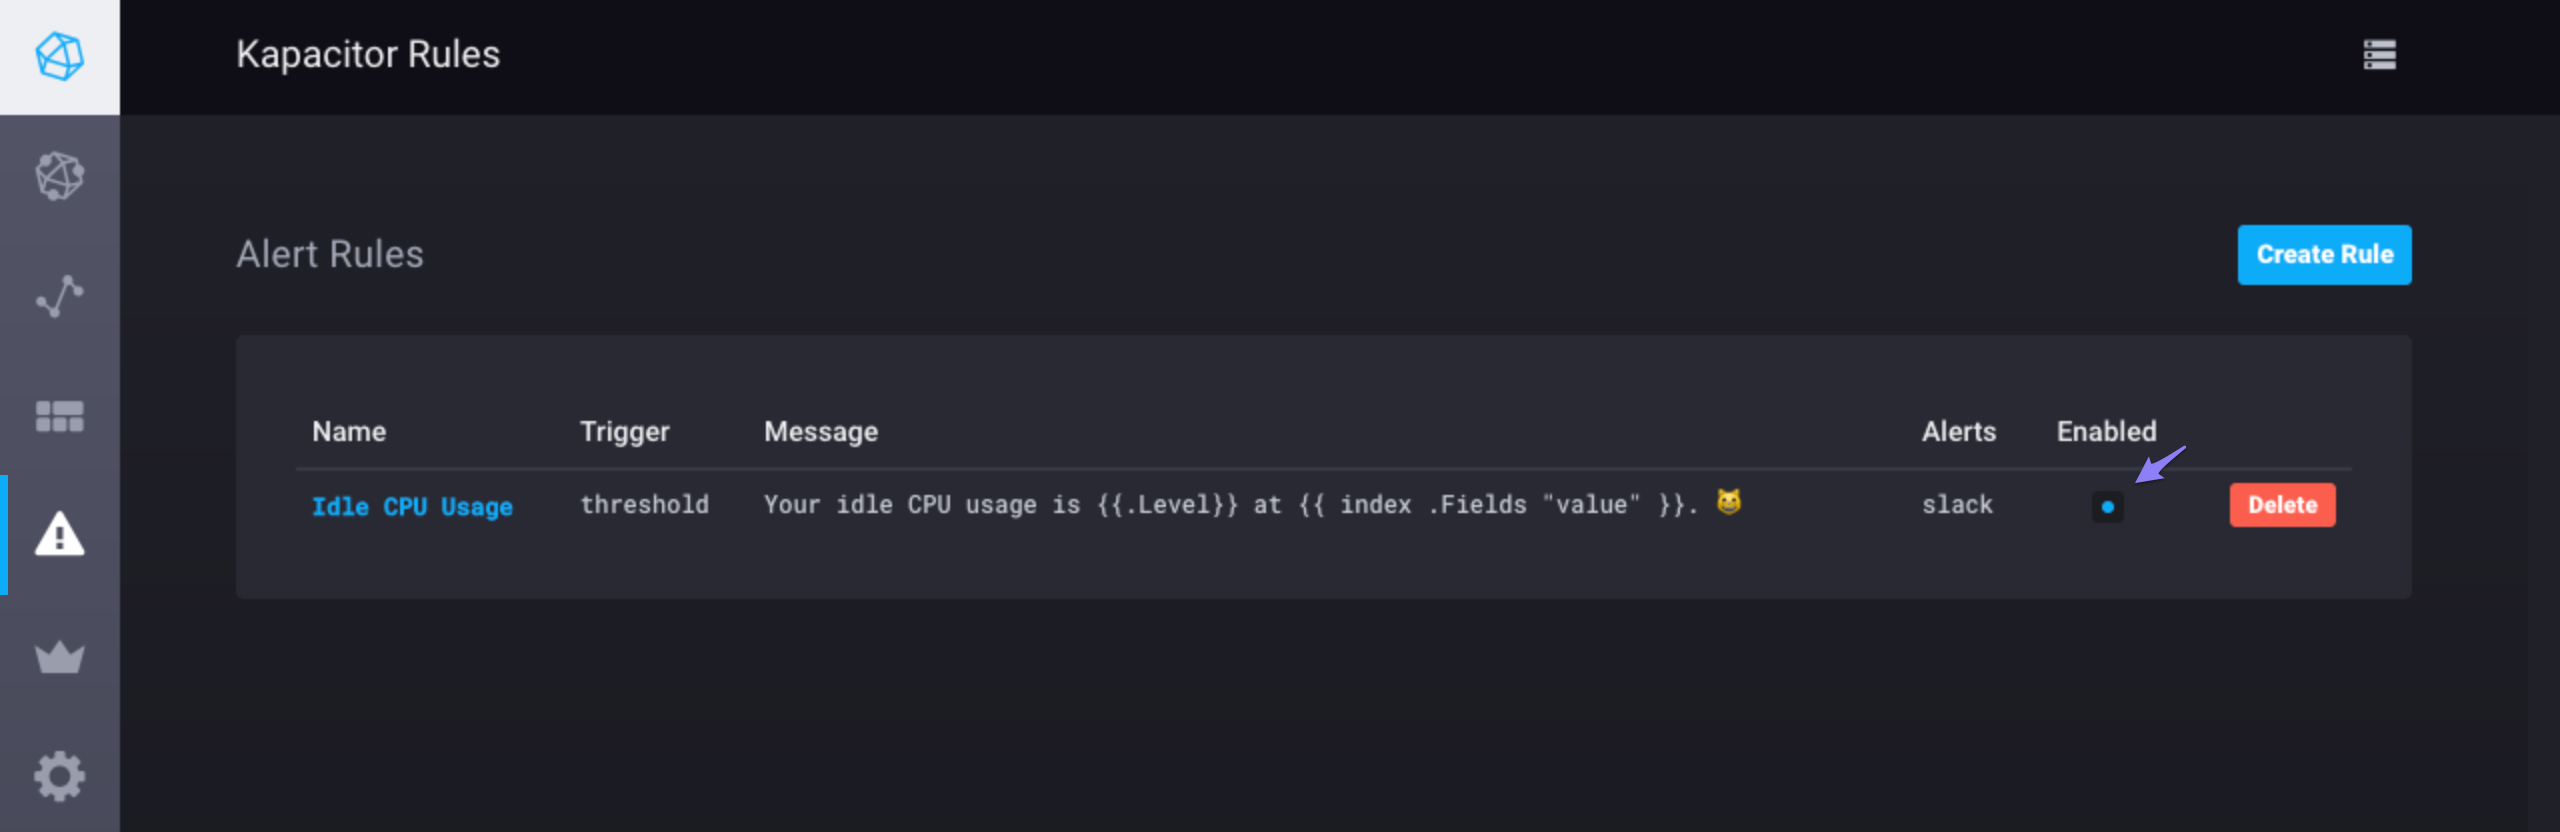
Next, move on to the section below to experience your alert rule in action.
View the alert in practice
Step 1: Create some load on your system
The purpose of this step is to generate enough load on your system to trigger an alert.
More specifically, your idle CPU usage must dip below 80%.
On the machine that’s running Telegraf, enter the following command in the terminal to start some while loops:
while true; do i=0; done
Let it run for a few seconds or minutes before terminating it.
On most systems, kill the script by using Ctrl+C.
Step 2: Visit Slack
Go to the Slack channel that you specified in the previous section.
In this example, it’s the #chronocats channel.
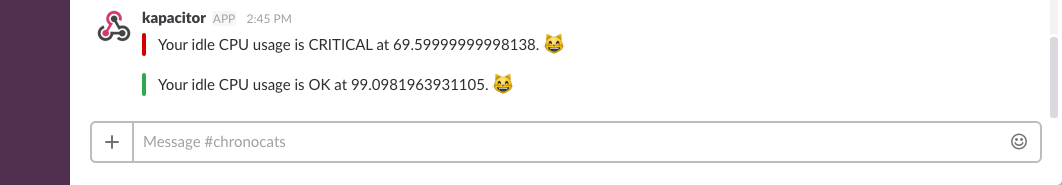
Assuming the first step was successful, #chronograf should reveal at least two alert messages:
- The first alert message indicates that your idle CPU usage was
CRITICAL, that is, it dipped below80%. The specific field value that triggered the alert is69.59999999998138. - The second alert message indicates that your idle CPU usage returned to an
OKlevel of80%or above. The specific field value that triggered the alert is99.0981963931105.
That’s it! You’ve successfully used Chronograf to configure a Kapacitor alert rule to monitor your idle CPU usage.