This is archived documentation for InfluxData product versions that are no longer maintained. For newer documentation, see the latest InfluxData documentation.
Chronograf offers a complete dashboard solution for visualizing your data and monitoring your infrastructure. Use Chronograf’s pre-created dashboards or create custom dashboards to meet your requirements. This guide shows you how to create custom Chronograf dashboards.
By the end of this guide, you’ll be aware of the tools available to you for creating dashboards similar to this example:

Requirements
To perform the tasks in this guide, you must have a working Chronograf instance that is connected to an InfluxDB source. Data is accessed using the Telegraf system input plugins. For more information, see Configuring Chronograf.
Build a Dashboard
Click Dashboards in the navigation bar and then click the Create Dashboard button. A new dashboard is created and ready to begin adding cells.
Step 1: Name your dashboard
Click Name This Dashboard and type a new name. In this guide, “ChronoDash” is used.
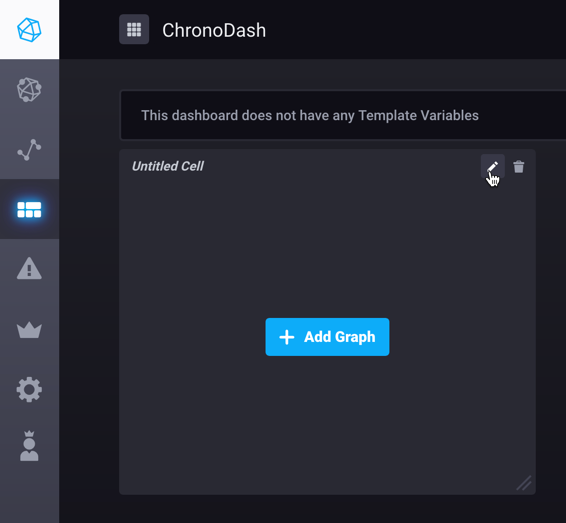
Step 2: Enter cell editor mode
In the first cell, titled “Untitled Cell”, click Edit to open the cell editor mode.
Step 3: Create your query
Click the Add a Query button to create an InfluxQL query. In query editor mode, use the builder to select from your existing data and allow Chronograf to format the query for you. Alternatively, manually enter and edit a query. Chronograf allows you to move seamlessly between using the builder and manually editing the query; when possible, the interface automatically populates the builder with the information from your raw query.
For our example, the query builder is used to generate a query that shows the average idle CPU usage grouped by host (in this case, there are three hosts).
By default, Chronograf applies the MEAN() function to the data, groups averages into auto-generated time intervals (:interval:), and shows data for the past hour (:dashboardTime:).
Those defaults are configurable using the query builder or by manually editing the query.
In addition, the time range (:dashboardTime:) is configurable on the dashboard.

Step 4: Choose your visualization type
Chronograf supports many different visualization types. To choose a visualization type, click Visualization and select Step-Plot Graph.

Step 5: Save your cell
Click Save (the green checkmark icon) to save your cell.
Note: if you navigate away from this page without clicking Save, your work will not be saved.
Step 6: Configure your dashboard
Customize cells:
- You can change the name of the cell from “Untitled Cell” by returning to the cell editor mode, clicking on the name, and renaming it. Remember to save your changes.
- Move your cell around by clicking its top bar and dragging it around the page
- Resize your cell by clicking and dragging its bottom right corner
Explore cell data:
- Zoom in on your cell by clicking and dragging your mouse over the area of interest
- Pan over your cell data by pressing the shift key and clicking and dragging your mouse over the graph
- Reset your cell by double-clicking your mouse in the cell window
Note: These tips only apply to the line, stacked, step-plot, and line+stat visualization types.
Configure dashboard-wide settings:
- You can change the dashboard’s auto-refresh interval at the top of the page - the default interval selected is Every 15 seconds.
- You can also modify the dashboard’s time range at the top of the page - the default range is Past 15 minutes.
Now, you are free to experiment and complete your dashboard by creating, editing, and repositioning more cells!
Extra Tips
Full screen mode
View your dashboard in full screen mode by clicking on the full screen icon in the top right corner of your dashboard. To exit full screen mode, press the Esc key.
Template variables
Dashboards support template variables. See the Dashboard Template Variables guide for more information.