This is archived documentation for InfluxData product versions that are no longer maintained. For newer documentation, see the latest InfluxData documentation.
This section covers the available tools for interacting with InfluxDB.
CLI/Shell
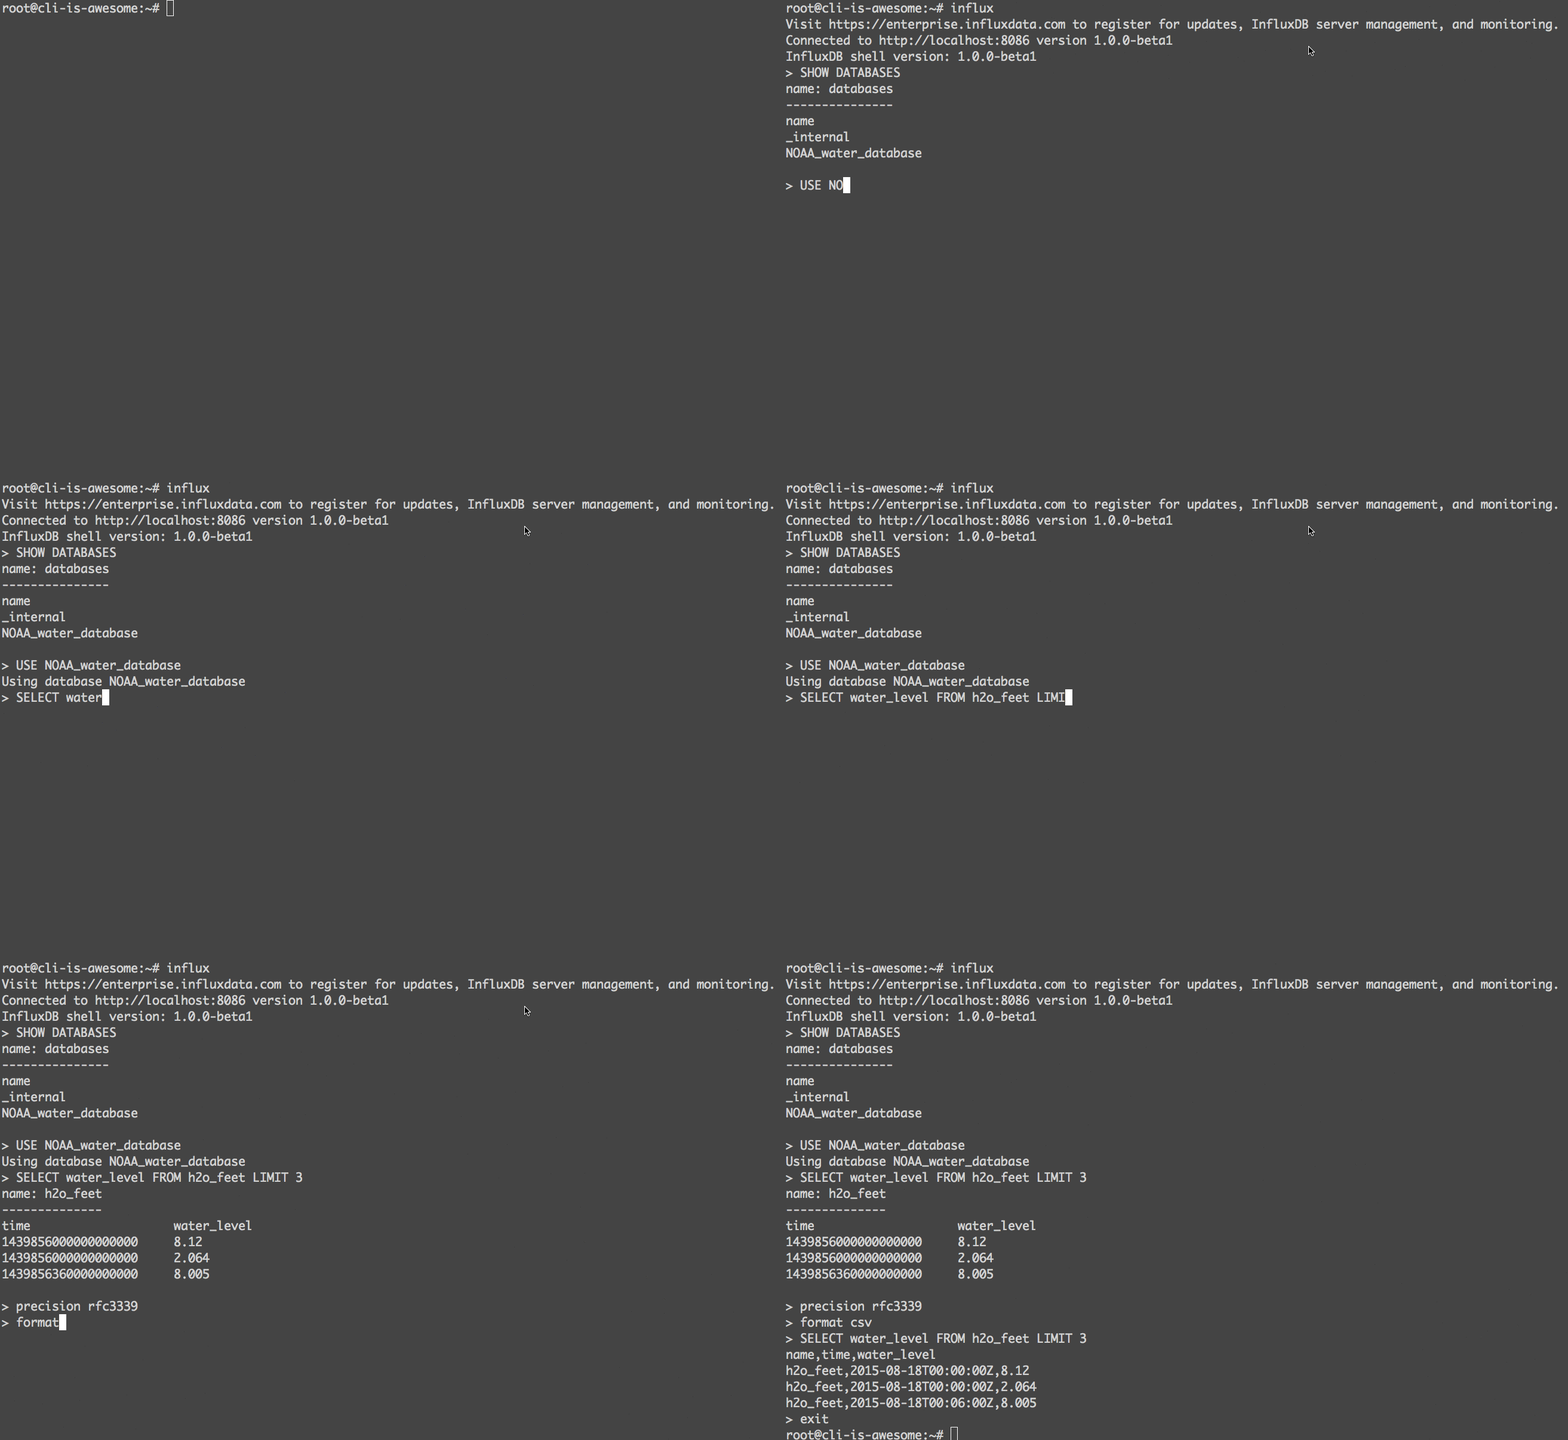
InfluxDB’s Command Line Interface (influx) is an interactive shell for the
HTTP API that comes with every InfluxDB package.
Use influx to write data (manually or from a file), query data interactively,
and view query output in different formats:

Go straight to the documentation on:
API Reference
Reference documentation for InfluxDB’s HTTP API.
Go straight to the reference documentation on:
For friendlier documentation, see the guides on writing data and querying data with the HTTP API.
API Client Libraries
The list of client libraries for interacting with InfluxDB.
Web Admin Interface
InfluxDB’s built-in web administration GUI. The built-in web administration GUI is deprecated in InfluxDB 1.2 and is disabled by default. We recommend using the HTTP API or the Command Line Interface to interact with InfluxDB.
Influx Inspect
Influx Inspect is a tool designed to view detailed information about on disk shards, as well as export data from a shard to line protocol that can be inserted back into the database.
Grafana Graphs and Dashboards
Grafana is a convenient dashboard tool for visualizing time series data. It was originally built for Graphite, modeled after Kibana, and since been updated to support InfluxDB.
Because of the changes to the SHOW SERIES and SHOW TAG VALUES formats in InfluxDB 0.11, InfluxDB 1.2 will not work with the Query Editor in Grafana 2.6.
This issue does not affect existing queries and dashboards or users working with Grafana 3.0.
Service Plugins
InfluxDB accepts writes over UDP and provides an easy way to set up Graphite, CollectD, and OpenTSDB as input sources.